Live map
The live map allows a visual simulation of the vehicle interaction information with Google-Maps integration, allowing live display with panning and zooming. Physical vehicle properties are displayed alongside (below) and may include vehicles without GPS location systems (which cannot be plotted on the map) to give a clear rendition of the state of the fleet on site at the given time.
The use of high accuracy GPS equipment allows the visual simulation to show highly accurate (within a few centimeters) positioning and movement which is especially helpful during inquiries into accidents or incidents.
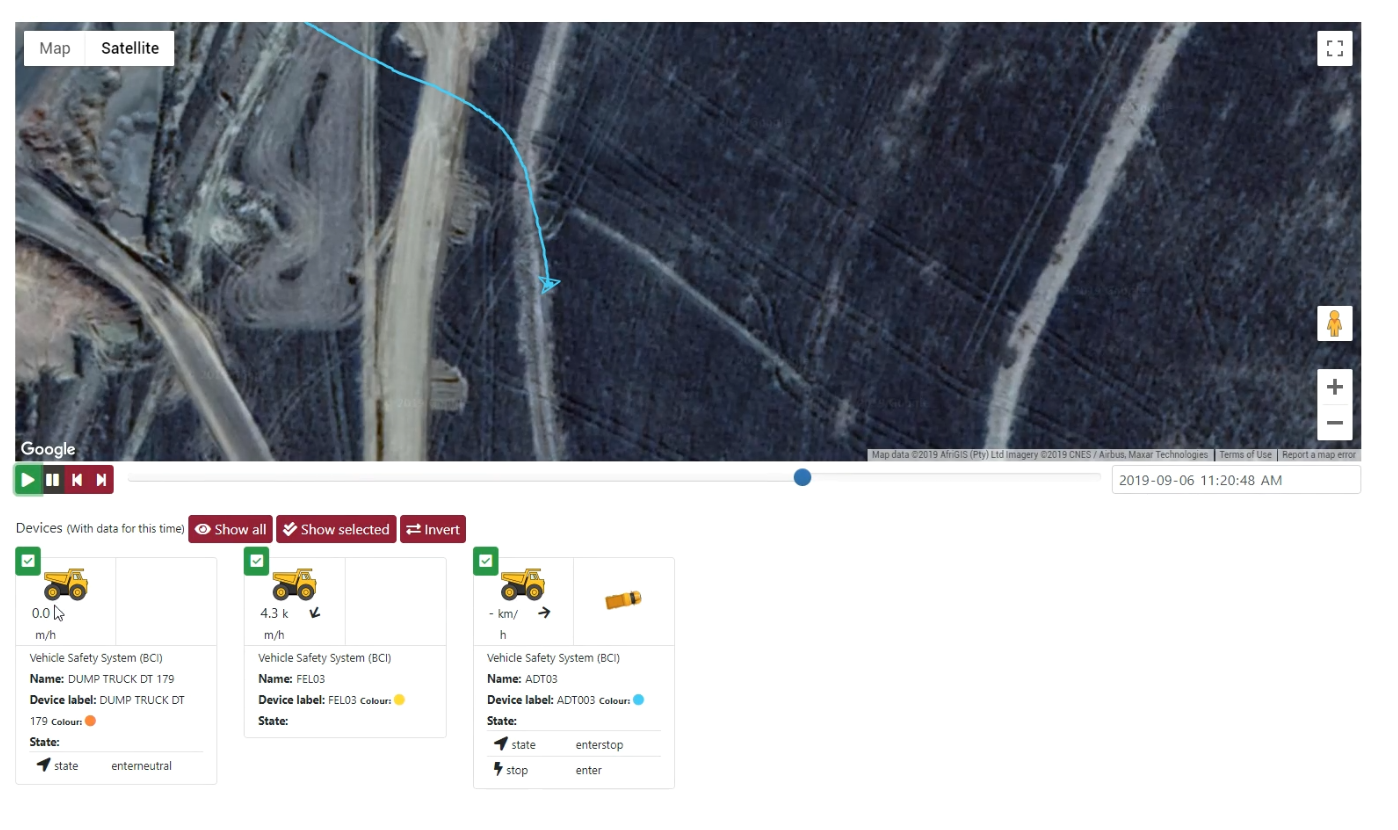
Individual vehicles can be selected and studied by themselves, or within a subset of vehicles, for very precise placement and time-frame. All timings are recorded in UTC and, based on the viewer's settings, can be displayed in any local timezone anywhere in the World.
Once an area and time-frame of interest have been identified, the specific information can be exported to Keyhole-Markup-Language (KML) files and viewed in Google-Earth (see below) or another KML viewer.
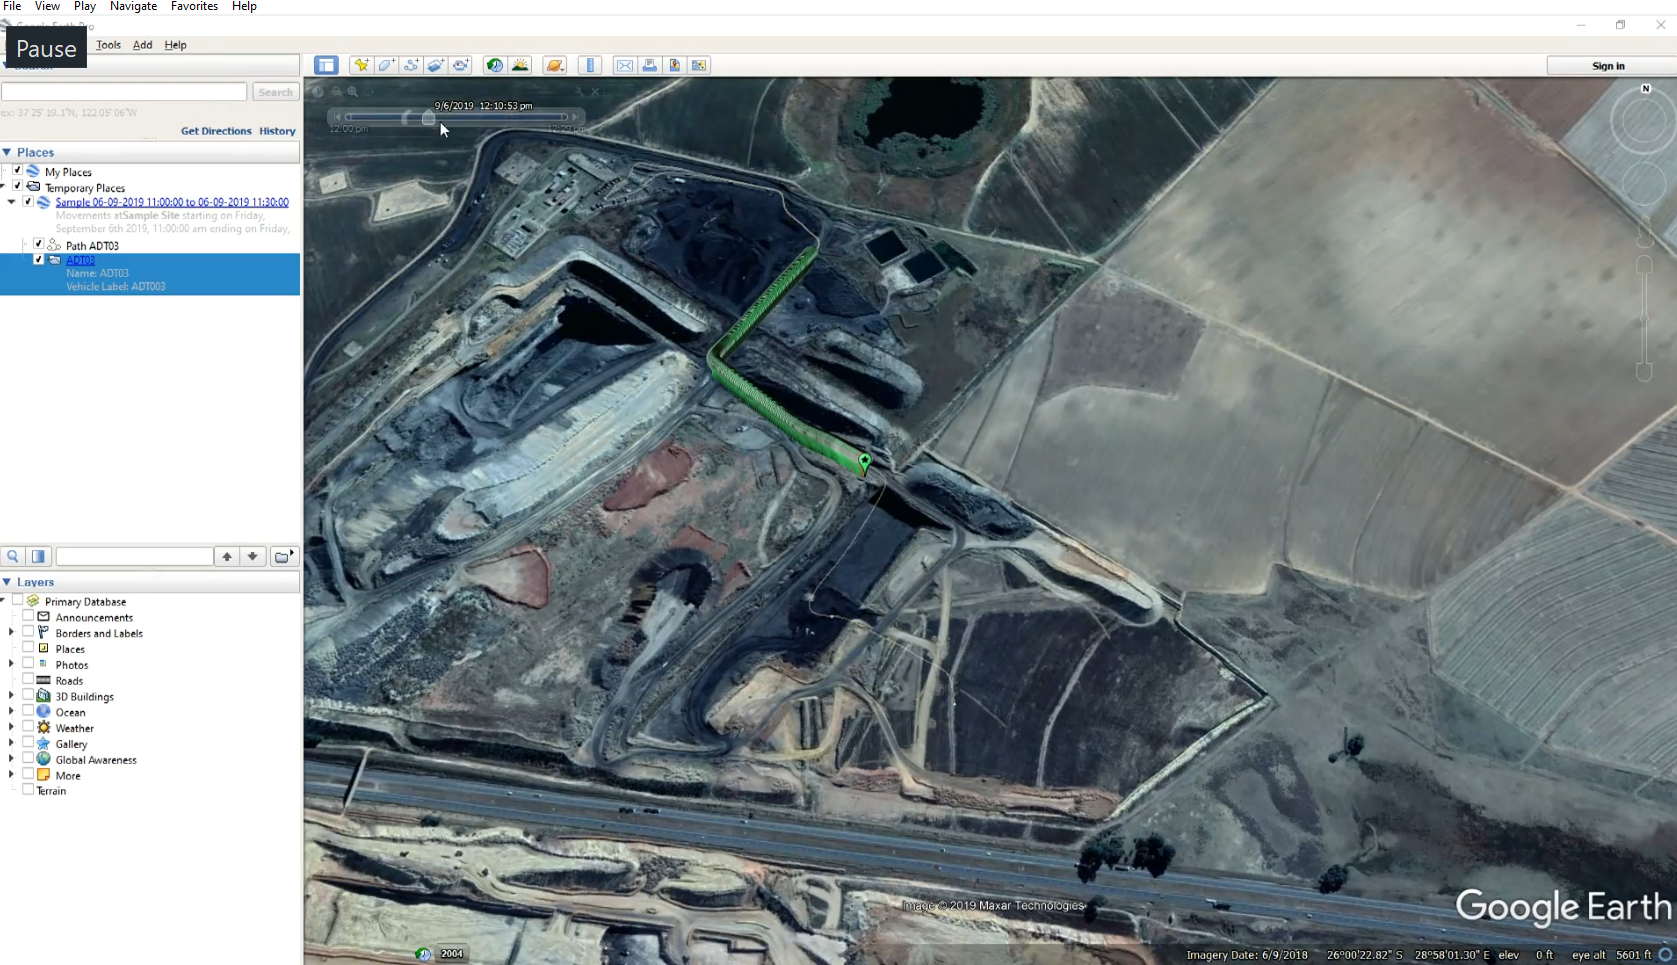
The KML data includes important information for every moving entity (note the sections where positional markers go Red in the animation above) which can be revealed by clicking the markers[1].
KML data files offer a way of viewing the data outside the BEAMS environment, sending it to third-parties or perhaps entering into exhibition for training, marketing, or legal indemnification or corroborating purposes.
[1] Behaviour related to Google-Earth. Other viewers may offer different methods of viewing/accessing the point-in-time data.